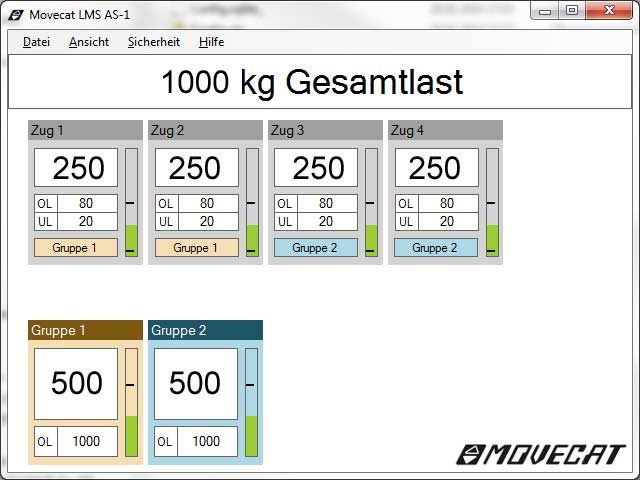
 With its new LMS AS-1 application, Movecat has introduced a PC-compatible item of visualization and analysis software for up to 48 LMS load measuring sensors in the I-Motion network with the controllers MPC-4ID8 and MPC-4IC1. The software is capable of displaying individual loads, load groups and the total load from all sensors. Up to four individual load groups including their respective overload threshold values can be defined.
It also offers the individual definition, evaluation and display of overload and underload conditions as well as automatic logging in 24-hour sustained operation. The under- and overload threshold values can be programmed separately for each sensor.
The results can also be displayed – even weeks later – in time grids ranging in size from 24 hours to one second and PDF files produced for documentation purposes.
Caption: Movecat’s LMS AS-1 software (photo: Think Abele, may be reproduced freely provided source is named)
Think Abele GmbH & Co. KG
Rudolf-Diesel-Strasse 23
71154 Nufringen, Germany
Contact: Andrew Abele
Phone: +49 (0) 70 32 / 98 51-0
Internet: www.thinkabele.de
{phocagallery view=category|categoryid=6|imageid=1810}


